Lontra Metrics - Our Free Amazon Analytics Dashboard!

by Sean Stone • Last updated June 6, 2023

Bonus Material: Free Amazon Analytics Dashboard Here – Lontra Metrics

Today I’m going to show you exactly how to build an Amazon Analytics Dashboard that you and your team will love using, entirely for free. 

In fact, it’s the exact same one I’ve used to plan and manage multi-million dollar Amazon Accounts.

We have a video tutorial just below the image below, so scroll down if you prefer to watch video!

Disclosures:

lontra metrics free google data studio dashboard

How do we maximize the profitability of our Amazon Accounts? Well, we focus on the most profitable kinds of sales, and maximizing those. 


What are the most profitable sales you can make? Organic Sales!


They’re also notoriously difficult to track, so we built a tool to track them easily and efficiently!


Grab a copy below.

Do you want to track and optimize your Amazon sales using data? Do you wish you could see all the metrics that matter to your business in one place? Do you want to save time and money by using a free dashboard that works with Google Data Studio and Google Sheets?


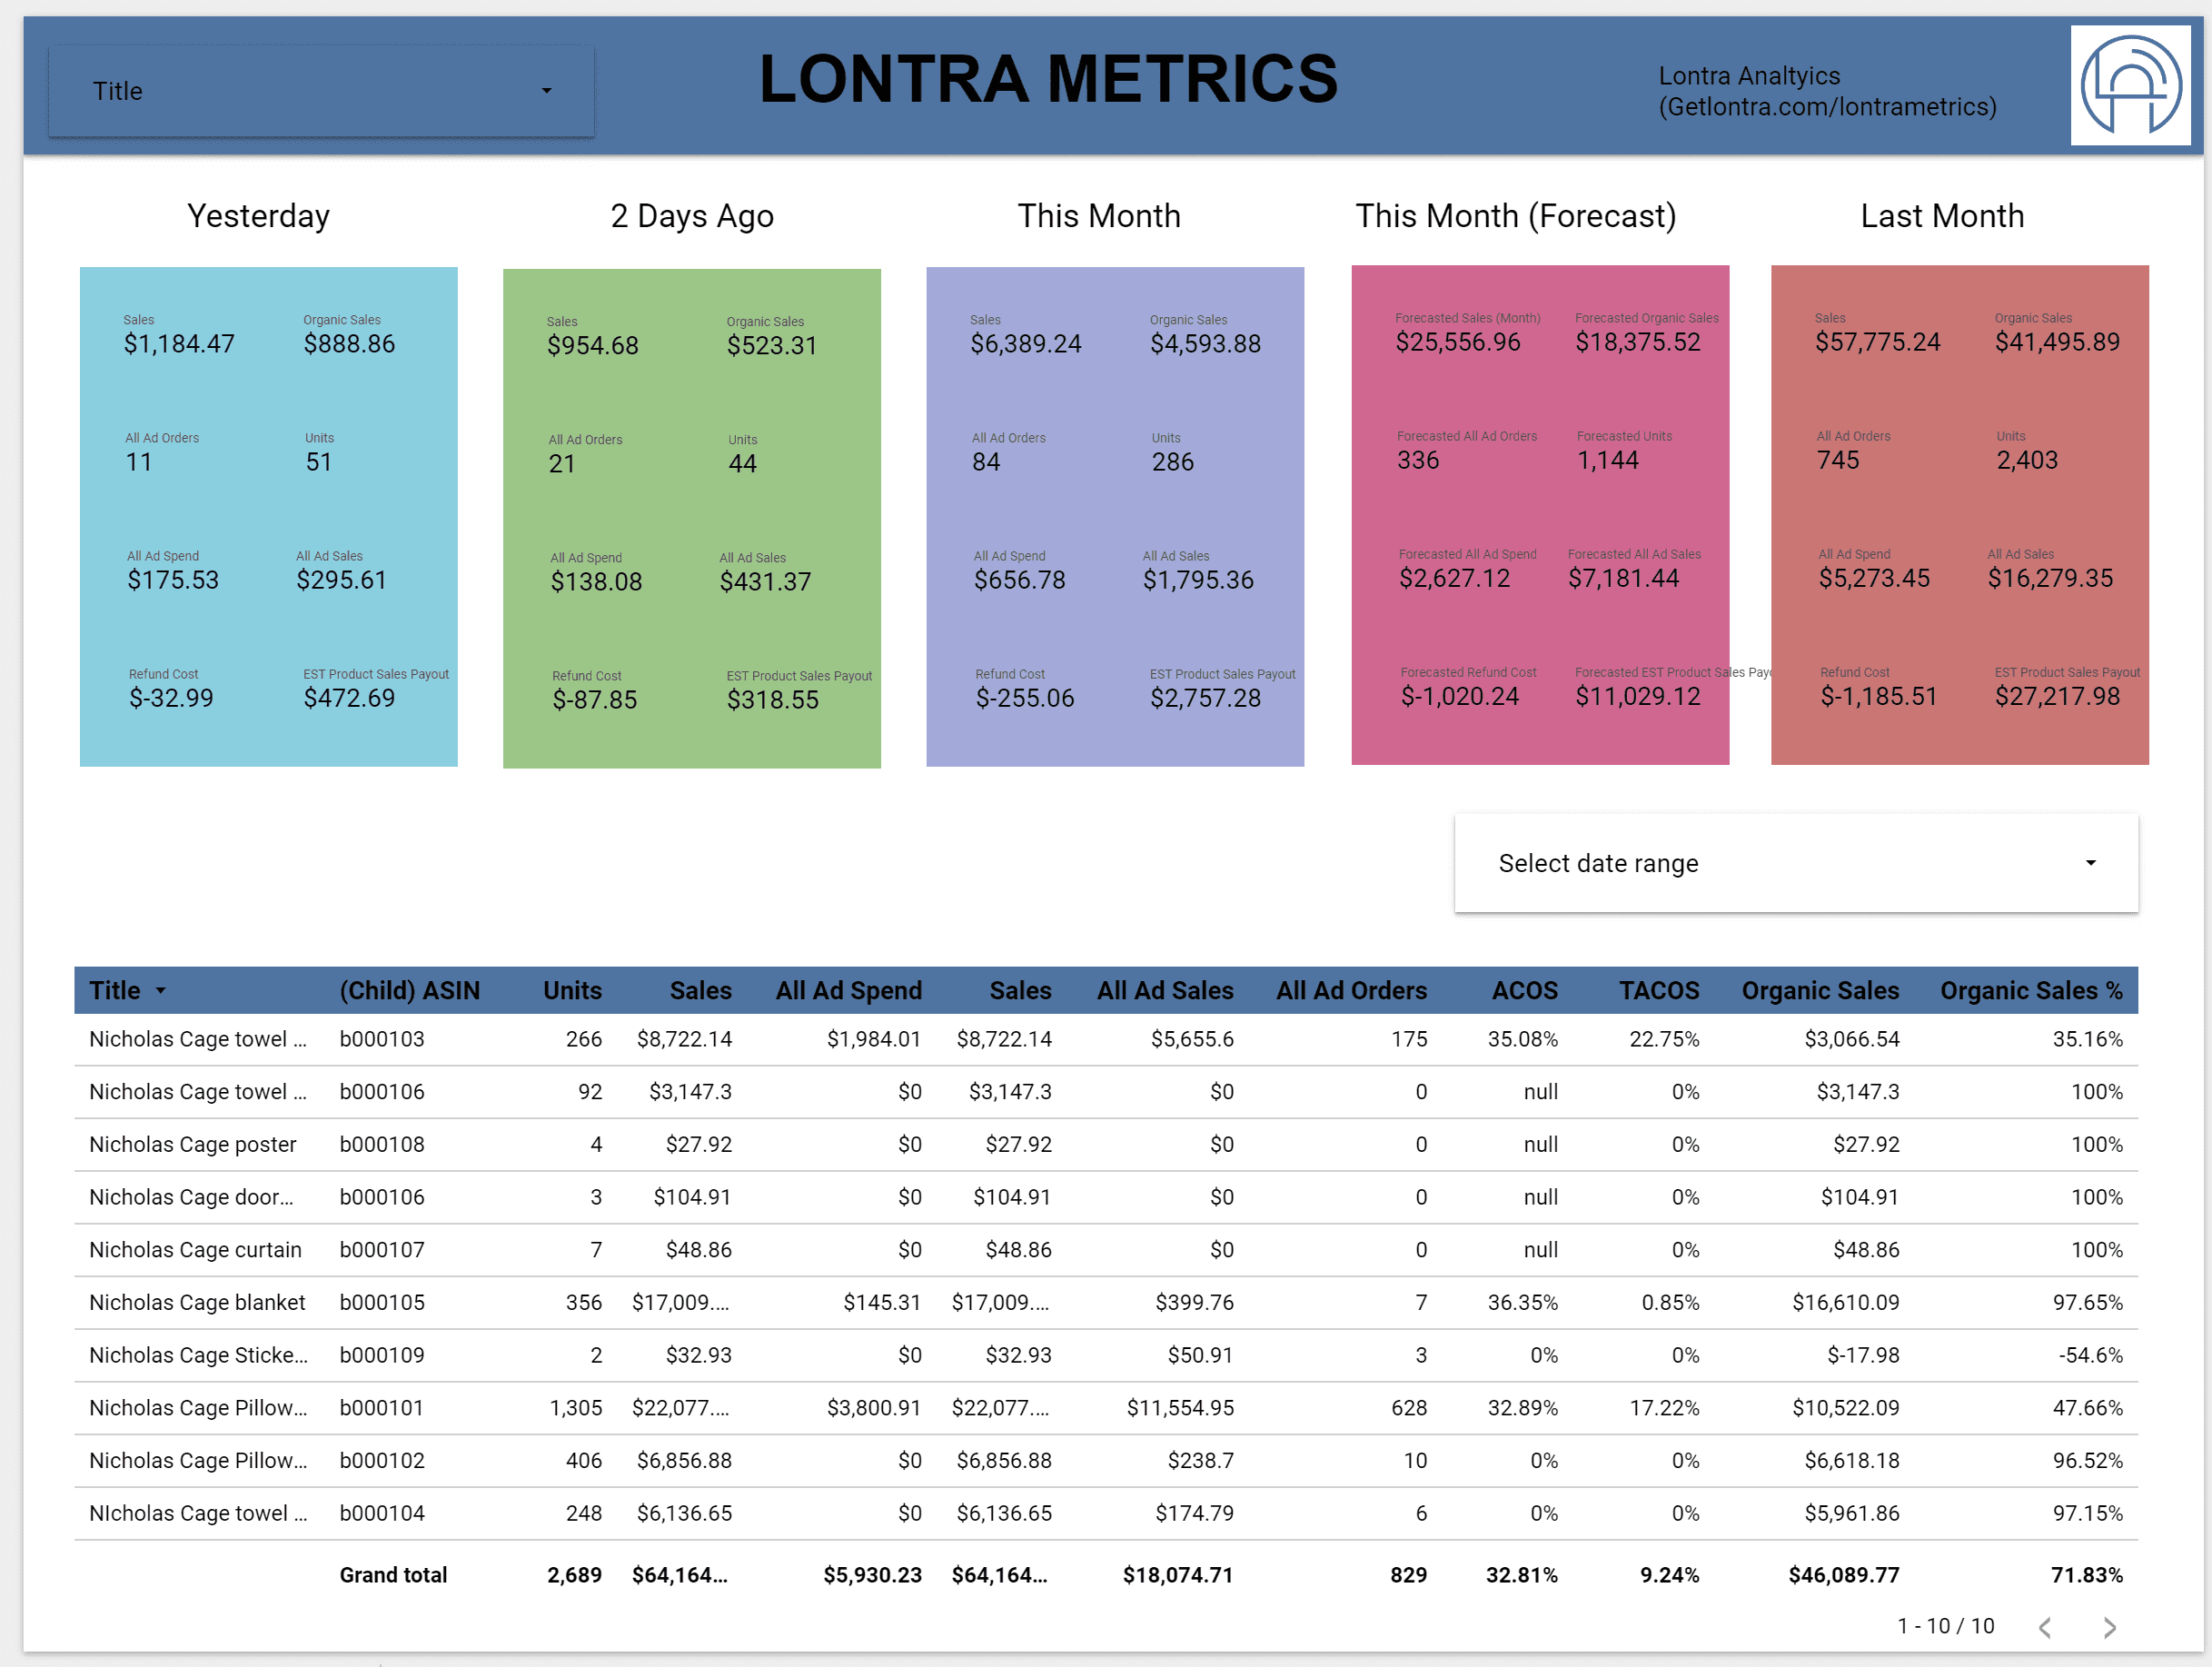
If you answered yes to any of these questions, then you’re in luck. We have created a free dashboard that gives you all the features you need to grow your Amazon business using data. It’s called Lontra Metrics, and it’s the ultimate dashboard for Amazon sellers.


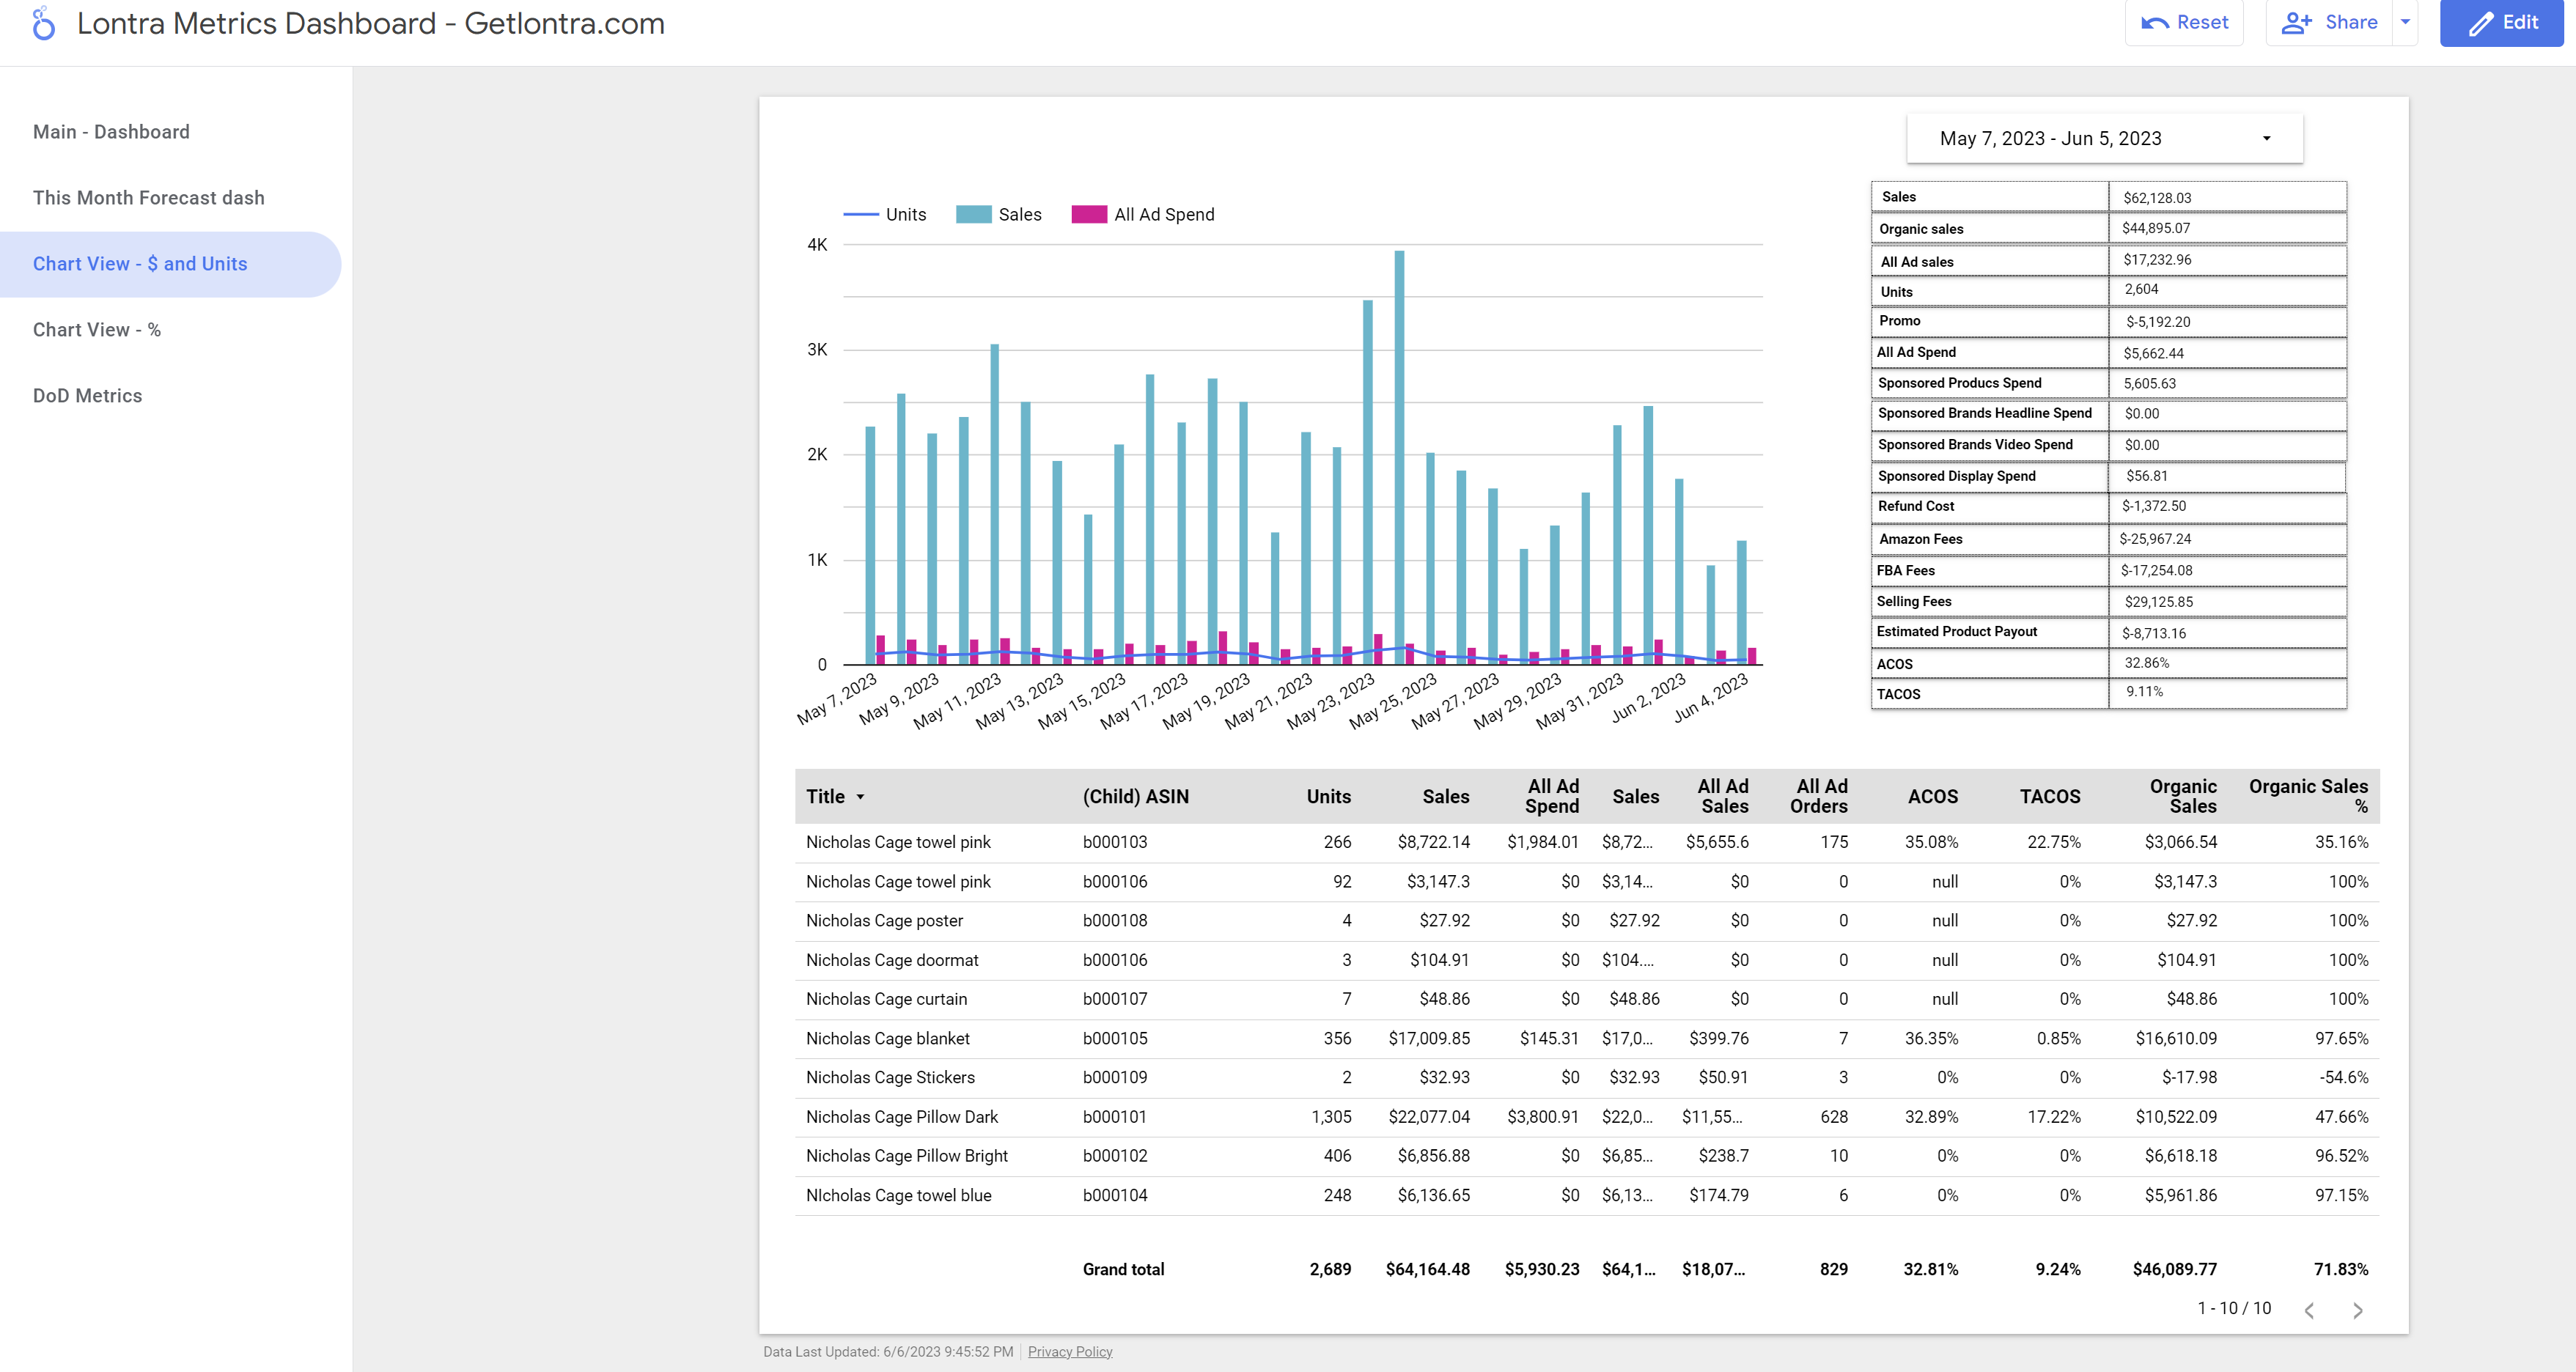
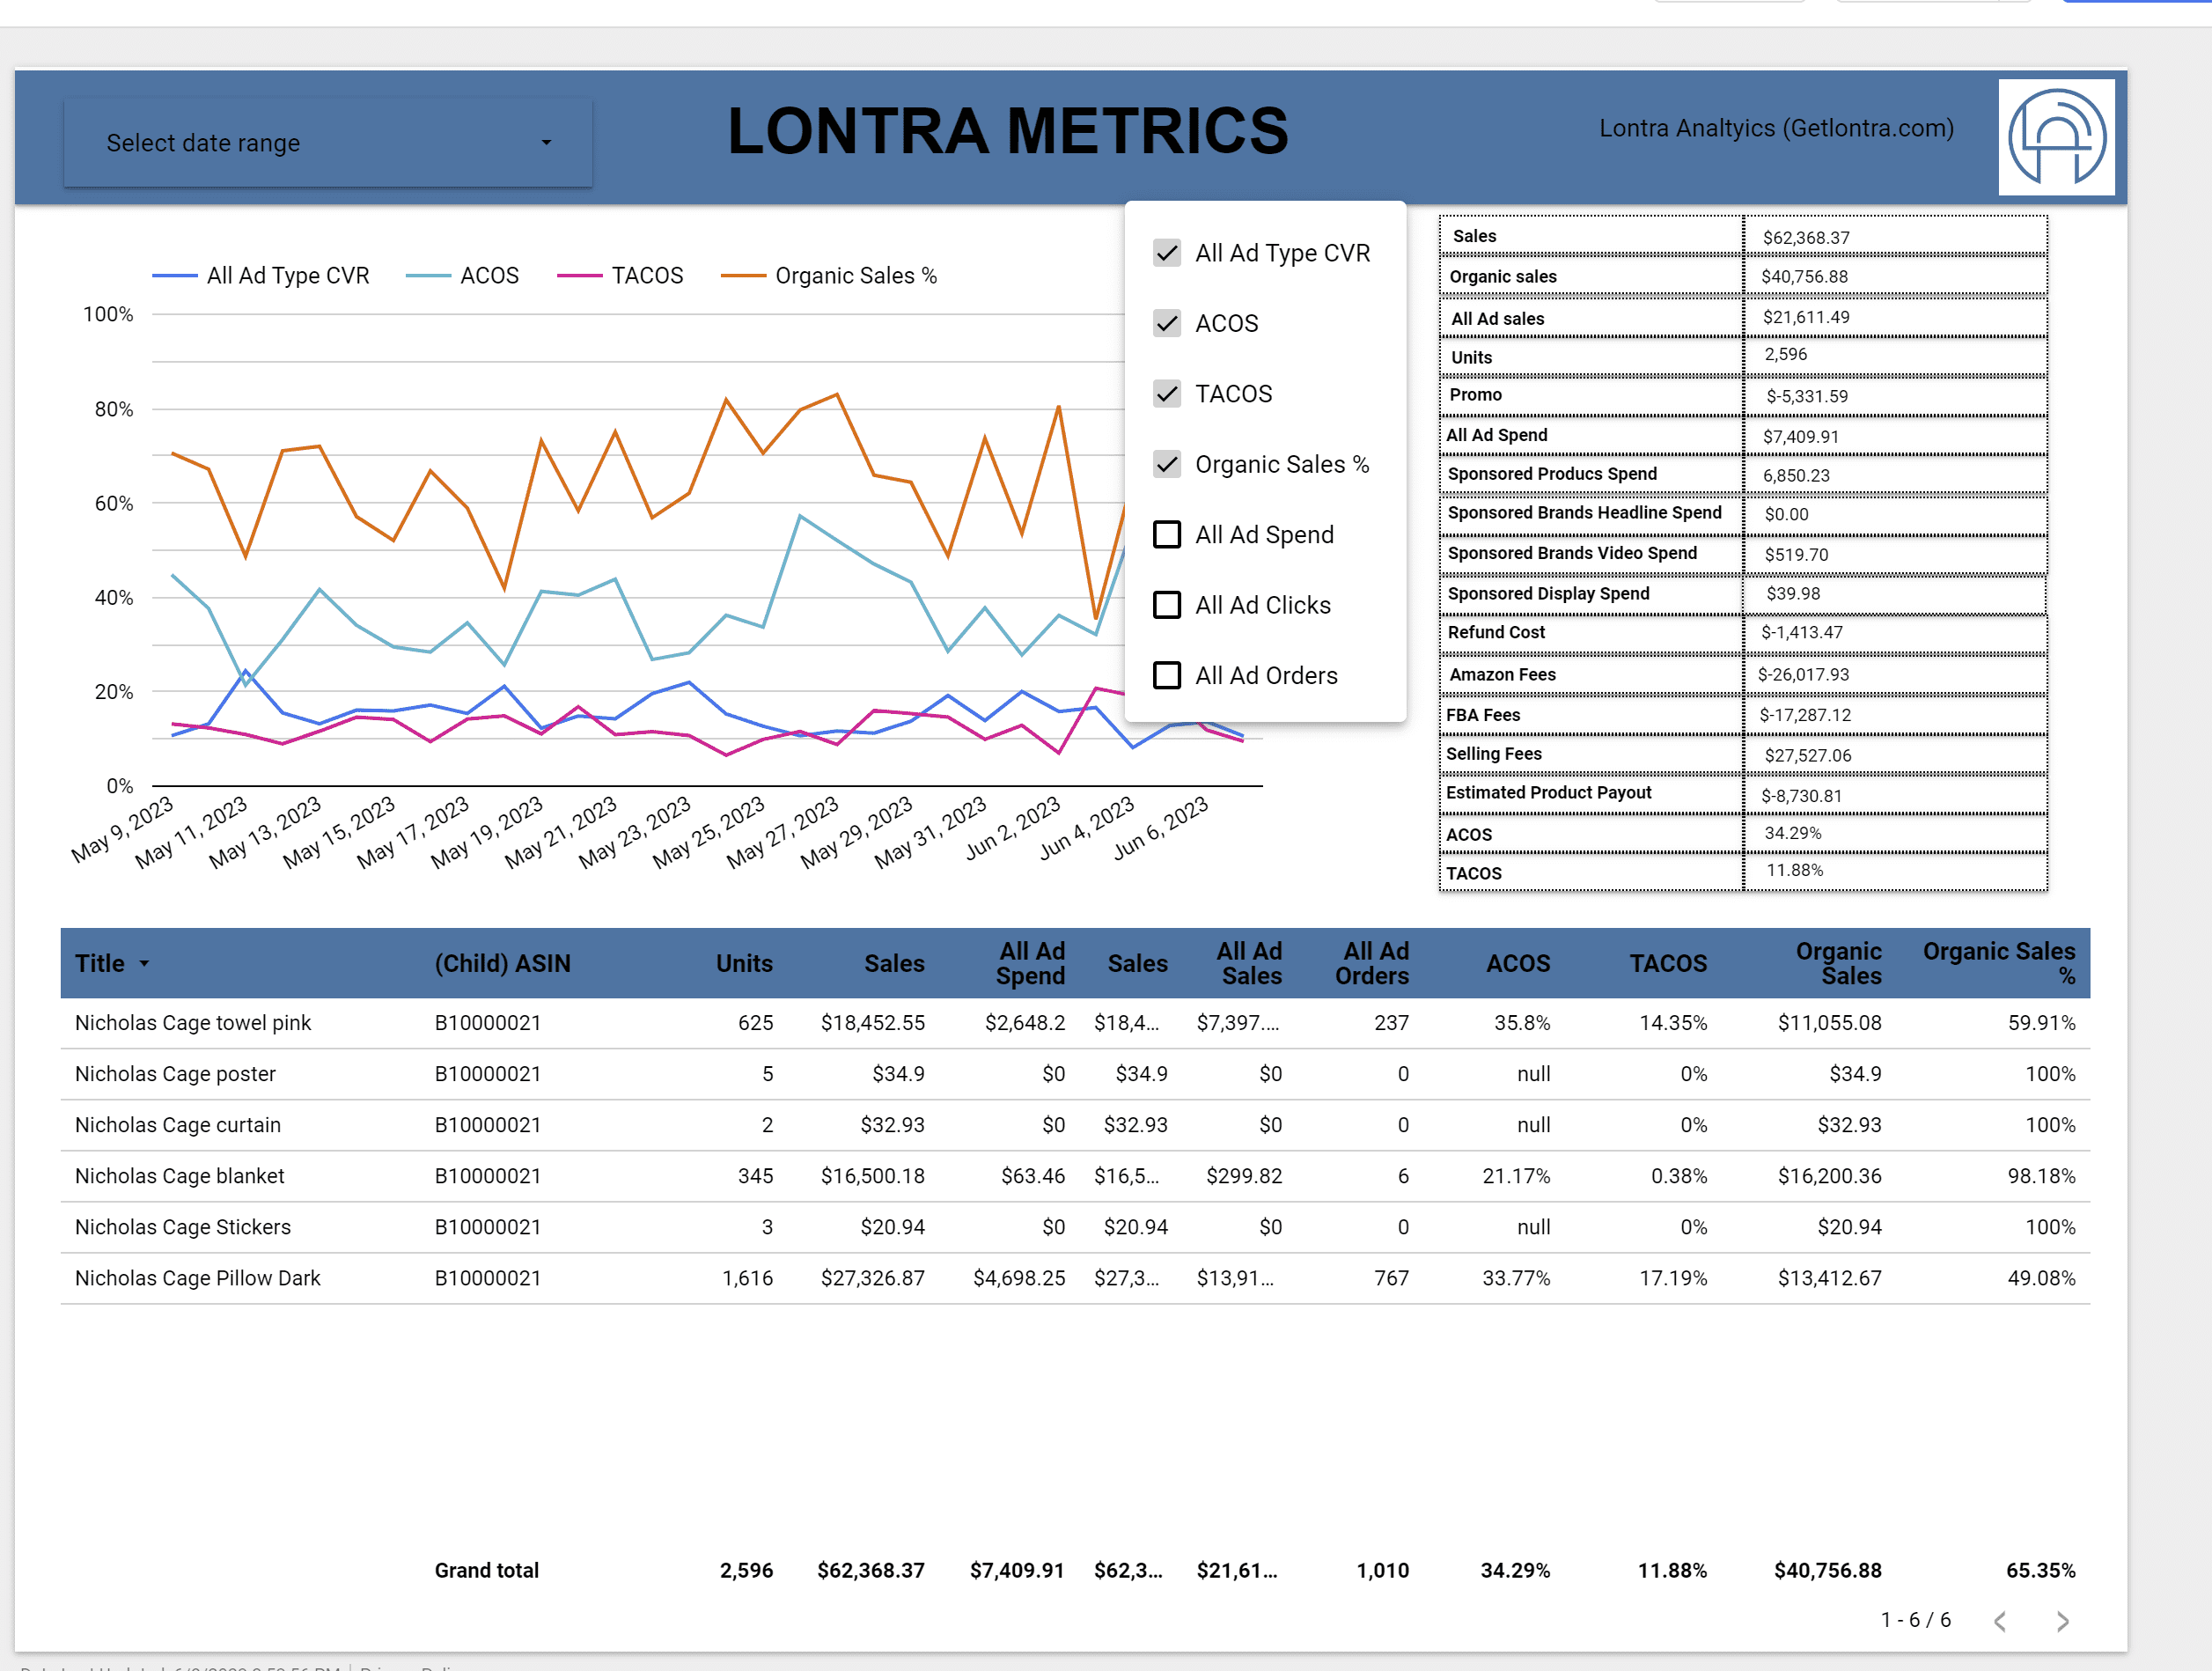
In this article, we’ll show you how to use Lontra Metrics to compare organic and PPC sales, monitor conversion rate, evaluate product performance, and more. We’ll also show you how to get the dashboard for free and how to connect it to your Amazon data.

Lontra Metrics - Amazon Analytics Dashboard
With a prioritized list of blog post topics planned out on one calendar, Freddie can keep organized, focus on deadlines, and be more productive all year long.

Why You Need A Dashboard Like Lontra Metrics

  • As an Amazon seller, you know how important it is to use data to make informed decisions about your Account.
  • You need to know how your products are performing, how your ads are converting, how your inventory is moving, and how your profits are growing.
  • But getting all this data can be a hassle. You may have to use multiple tools that don’t integrate well with each other.
  • You may have to export and import data manually, which can be time consuming and error prone. You may have to create your own spreadsheets and formulas, which can be complicated and tedious.
  • That’s why we created Lontra Metrics. Lontra Metrics is a free dashboard that gives you all the same metrics you love from your other favorite Amazon tools, but with a flexible and customizable UI in Google Data Studio.
  • Google Data Studio is a free data visualization software that lets you create stunning dashboards and reports with ease.

How to Get the Dashboard for Free

Getting Lontra Metrics is easy. All you need is a Google account and an Amazon account. Here are the steps:

  1. Go to getlontra.com/lontrametrics and sign up using your email address (you’ve already done this step. Congrats!) 
  2. Download the Excel template that we provide.
    1. This template contains all the formulas and macros that you need to use the dashboard.
  3. Gather the data from your Amazon account. You can do this by using date range reports, bulk operations, and sponsored ads reports. We’ll show you how to do this in the next section.
    1. We provide step by step instructions below so you can give this to a virtual assistant!
  4. Paste the data into the Excel template.
    1. Run the macro to get day over day data.
    2. Drag down the formulas to populate the spreadsheet with the metrics you need.
  5. Create a new Google Sheet and copy the data from the Excel template into it.
    1. We do this to save you time and headache
    2. Technically Google Data Studio connects with excel, but in practice it’s a nightmare
  6. Copy the link of the Google Sheet and paste it into Google Data Studio data connection.
  7. Check that all the data is correct and ready for analysis.
Lontra Metrics Organic Sales Percentage

SOP for Connecting to Lontra Metrics:

Get Started

  • Log in to your Amazon Seller Central account.
  • Choose the desired time period for the reports (e.g., Last 30 days) to ensure consistency across all reports.
  • Select each report type one by one and follow the steps below

Sponsored Products Advertised products:

  • Choose the “Advertising” or “Campaign Manager” section.
  • Select the “Reports” tab.
  • Choose the “Sponsored Products” category.
  • Set the report type to “Advertised products.”
  • Set the frequency to “Daily” instead of summary.
  • Generate and download the report.

Sponsored Products Purchased products:

  • Choose the “Advertising” or “Campaign Manager” section.
  • Select the “Reports” tab.
  • Choose the “Sponsored Products” category.
  • Set the report type to “Purchased products.”
  • Set the frequency to “Daily” instead of summary.
  • Generate and download the report.

Sponsored Display Advertised products:

  • Choose the “Advertising” or “Campaign Manager” section.
  • Select the “Reports” tab.
  • Choose the “Sponsored Display” category.
  • Set the report type to “Advertised products.”
  • Set the frequency to “Daily” instead of summary.
  • Generate and download the report.

Sponsored Display Purchased products:

  • Choose the “Advertising” or “Campaign Manager” section.
  • Select the “Reports” tab.
  • Choose the “Sponsored Display” category.
  • Set the report type to “Purchased products.”
  • Set the frequency to “Daily” instead of summary.
  • Generate and download the report.

Sponsored Brands Bulk Operations:

  • Choose the “Advertising” or “Campaign Manager” section.
  • Select the “Reports” tab.
  • Choose the “Sponsored Brands” category.
  • Look for the “Bulk Operations” report.
  • Set the frequency to “Daily” instead of summary.
  • Generate and download the report.

Sponsored Brands Attributed Purchases:

  • Choose the “Advertising” or “Campaign Manager” section.
  • Select the “Reports” tab.
  • Choose the “Sponsored Brands” category.
  • Set the report type to “Attributed Purchases”
  • Set the frequency to “Daily” instead of summary.

Generate and download the report.

Sponsored Brands Campaign Report:

  • Choose the “Advertising” or “Campaign Manager” section.
  • Select the “Reports” tab.
  • Choose the “Sponsored Brands” category.
  • Set the report type to “Campaign Report”
  • Set the frequency to “Daily” instead of summary.
  • Generate and download the report.

Business Reports by ASIN:

  • Navigate to the “Reports” tab or section.
  • Choose the “Business Reports” category.
  • Specify the desired date range.
  • Note this is the only report that is not a daily report
  • Generate and download the report.

Get Date Range Reports Data

  • Reports > Payments > Date Range Reports:
  • Go to the “Reports” tab or section.
  • Choose the “Payments” category.
  • Select “Date Range Reports.
  • Specify the desired date range.
  • Generate and download the report.

Paste all of these reports into the corresponding Tabs in the Excel file

  • Before pasting, remember, do not paste over the yellow cells! That will lead to broken formulas, which will make everyone sad. 
  • Unique Dates – do not touch 
  • Macro Table – do not touch until after we run the Macro 
  • Date Range Reports = Date Range Reports 
  • Paste SD ADV = Sponsored Display Advertised Products 
  • Paste SD Purch Prod = Sponsored Display Purchased Products report 
  • Paste Business Reports = Business Reports by ASIN 
  • Paste SBA Campaign Report = Sponsored Brands Ads Campaign Report 
  • Paste SBA Bulk Operations = Sponsored Brands Ads Bulk Operations Report 
  • Paste SBA Attributed Purchases = Sponsored Brands Ads Attributed Purchases Report
  • Paste SPA ADV = Sponsored Products Advertised Product Report 
  • Paste SPA PP = Sponsored Products Purchased Product Report

Run the “Copy Formulas Down” Macro

  • Make sure your screen says “developer” at the top
    • If you don’t have that, follow the instructions on this page 
    • We cannot support you with this portion of the SOP as it’s an excel function. 

Run the “CopyPasteLoop” Macro

  • This will build you a day over day table in the Macro Table tab.

Run the “CopyFormulasInMacroTable” Macro

  • This will drag down the rest of the formulas for you, to make your final table. 

Final Step: Put the new Macro table in a Google sheet

  • Check for any obvious errors in the macro table
  • If all seems well, then copy the data in Macro Table and paste it into a new google sheet
    • Make sure the sheet is shareable to make it easier to connect to the data
    • Technically, you can just use a CSV upload for this step, but we have seen a lot of trouble with that
    • Leave it open on your browser

Connect the data to your dashboard

  • Open our Demo Dashboard
  • Make a copy (file, make a copy)
  • Click on data and then “edit data source” which can be found by clicking on the Google sheet icon
  • Click “<- Edit Data Connection” on the left hand side of the page
  • On the next page, on the left hand side, underneath “All Items” click on URL
  • Paste the URL from your new spreadsheet into the google data studio
  • Connect them and hit continue.

Congratulations! You now have Lontra Metrics to play with!

Shameless Promotion from Lontra

How We Find Gaping Holes In The Accounts We Take Over

Learn more about our completely customizable software that we use to analyze and grow large Amazon Accounts in record time, without coding.

Stay In Touch

Enter your email address to register to our newsletter subscription!

sean@getlontra.com